
Really? Another blog about features in AFT software?
Yes, really. And there is a good reason for it. Because this new feature in AFT Impulse 8 will change your life. Well, it may not change your life, but it will forever change how you do your waterhammer analysis.
I am talking about the new multi-scenario graphing and animation feature. This brand, new feature really changes things.
Before I talk about this though, let me go back about 20 years. That is when we added a revolutionary new feature to AFT Impulse 2 (and other AFT software at that time) called Scenario Manager. Our users over the last 20 years have said Scenario Manager – just that feature alone – has been a game changer for them. And they tell us that here we are, 20 years later, and still no other engineering software comes close to this capability.
If I stopped there, and just extolled Scenario Manager in this article, I would be completely justified. But in AFT Impulse 8 we have raised the bar even further.
If you can bear with me, I want to first brag about the awesome graphing features AFT began adding to AFT Impulse since version 6 in year 2016. This allowed stacked graphs, double-Y graphs, crosshairs, a range finder, graph folders and an enhanced Graph List Manager for saving graphs for easy regeneration, plus more. We made it oh-so-easy to access all of these powerful features with the new Graph Guide back in 2016.
With that introduction of impressive features, AFT Impulse 8 now allows you to graph and animate your various scenarios within the same graph.
AFT Fathom 11 introduced multi-scenario pump vs. system curve graphs. That in itself was a very powerful new feature in AFT Fathom. But graphing in AFT Impulse has always been central – much more so than in AFT Fathom.
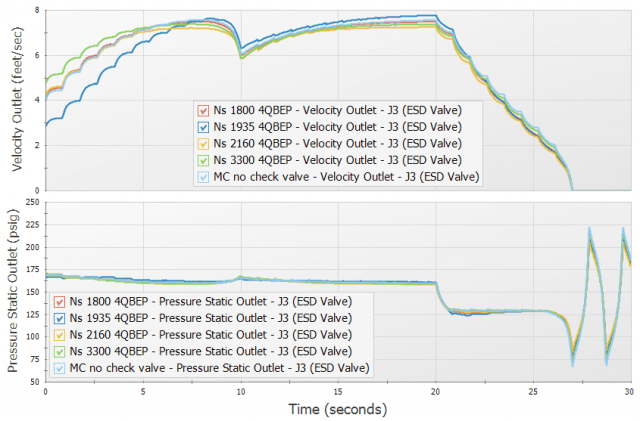
Want to see it with your own eyes? Here below in Figure 1 you can see five scenarios cross-plotted. Figure 2 below shows a screen shot of the same five scenarios playing an animation. It is just ridiculous.
As the original founder of AFT, way back in 1996 I wrote AFT Impulse 1, the world’s first visual waterhammer modeling software for Microsoft Windows. It is really incredible to see how far this internationally leading software has come.


AFT President & Founder | ASME Fellow - Trey founded AFT in 1993. He was the original developer of AFT Fathom (including the GSC and XTS modules), AFT Arrow and AFT Impulse. He was active in software development until 2011 and still works with the development team in addition to managing AFT. He has taught hundreds of training classes on AFT’s software products in twelve countries across every populated continent. He worked previously for General Dynamics in cryogenic rocket design and Babcock & Wilcox in steam/water equipment design. He holds a BSME (1985) and MSME (1986), both from the University of California, Santa Barbara. He is a registered Professional Engineer.