AFT Arrow Model of Natural Gas Distribution System in Tanzania Helps Confirm Expansion Plans
AFT Arrow™ Case Study
PanAfrican Energy | Natural Gas Distribution | Oil & Gas

“Given the confirmation of pressure drop to the intermediate gauge and
excellent agreement of all network pressures where upstream pressure
could be measured, the model generated excellent results.”
-The Lisbon Group, LLC
PROBLEM
- Potential for expansion with a downstream piping network following a new acquisition
- Expansion must be cost-effective and must have confidence in new gas volume commitments
ANALYSIS
- An AFT Arrow model was built and calibrated, enabling continuous evaluation of further expansion
- Used scenarios to compare base network to proposed expansion
SOLUTION
- Model matched field data to within 10% across a 45 km (28 mi) pipeline
- Expansion capacity was confirmed through model, allowing construction to begin with confidence
Ready to try AFT Impulse?
Problem Explained
When PanAfrican Energy Tanzania (PAET) had an acquisition on the horizon in Dar Es Salaam, Tanzania, they turned to AFT Arrow to help model and analyze a downstream piping network to assess gas deliverability for a network expansion. There was an opportunity to expand downstream and add a number of large new customers. Therefore, PAET needed to ensure the network could be expanded in a cost-effective manner and new gas volume commitments could be made with confidence.
As this network had not been expanded for a number of years, PAET worked with The Lisbon Group to develop and validate a model in AFT Arrow of the distribution network which delivers natural gas to industries primarily for power generation and process heating.
While this single-phase pipeline has no compositional variability, it does run an interesting path that includes railways and harbors. A number of rivers and swamps are crossed by this system.
Tools and Analysis
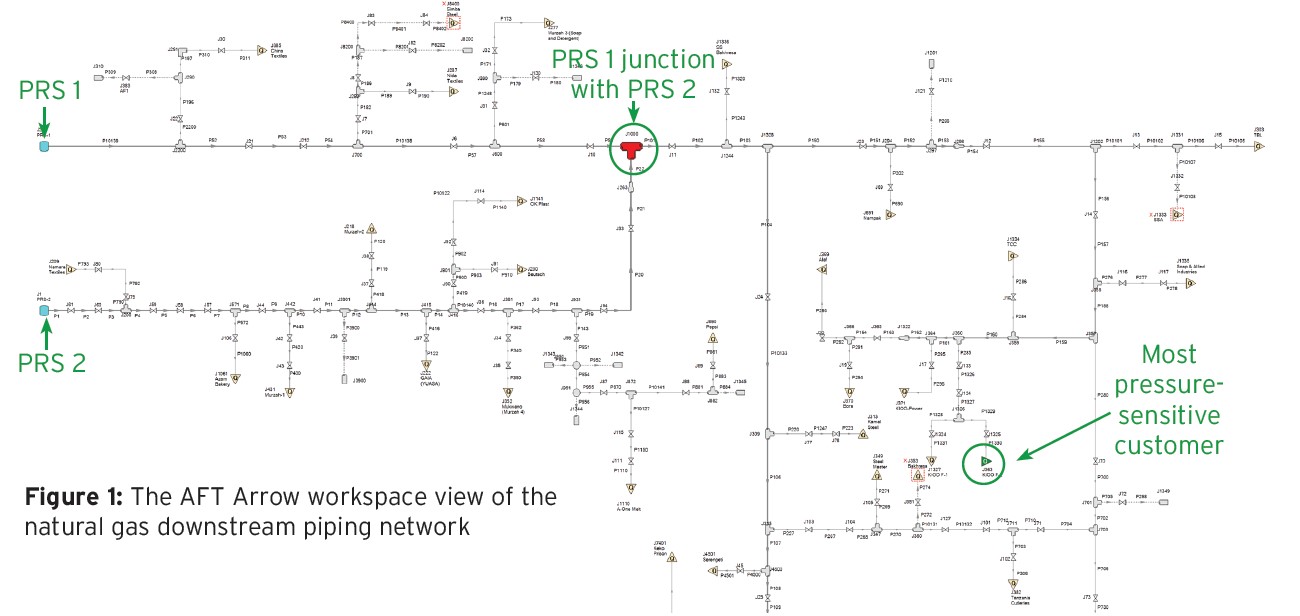
The primary distribution system takes off from the Songas transmission line with a steel line to two Main Supply Stations (also called Pressure Reduction Stations or PRS). From there the system is approx. 45 km (28 miles) of high pressure 16” Polyethylene (PE) pipeline. All gas demand is met via the two Pressure Reduction Stations (PRS) sites (Figure 1).
The AFT Arrow model was built with an orthographic grid and primarily used piping, junctions, tees, reducers, tanks, and valves. Downstream customers were modeled using the Assigned Flow junction. Because the piping system operated over a fairly narrow pressure and temperature range, the system was modeled as adiabatic (e.g. no heat transfer through pipes).
The hydraulic piping model consisted of three simulations including the base downstream network, the base simulation plus additional customers, and finally the previous two scenarios plus 0.641 MMscfd of new gas.
Solutions & Benefits
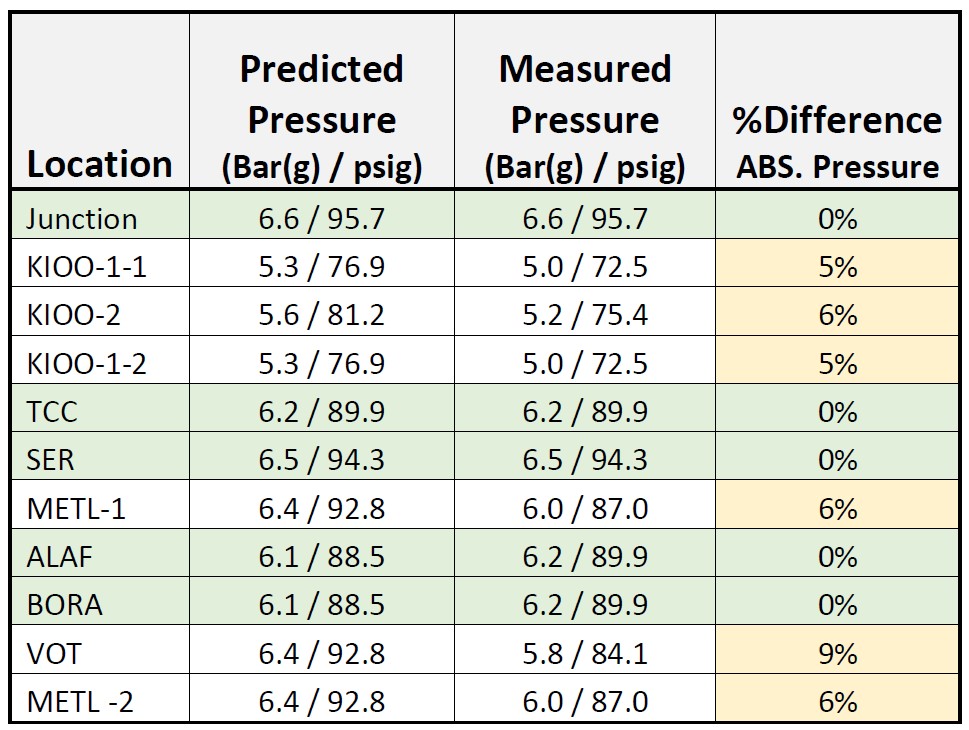
The modeling results agreed extremely well with measured pressures. Measured results were within the predicted value. The percent difference consistently reflected 6 – 10% lower than predicted measured pressure (Figure 2). This is attributed to some pressure drop through the back-up regulator rather than an accurate measurement of the pipeline pressure. This loss value matches the pressure drop through the nearby PRS exceptionally well.
Given the confirmation of pressure drop to the intermediate gauge, and excellent agreement of all network pressures where upstream pressure could be measured, the model generated excellent results.
Most importantly, PanAfrican Energy was able to confirm there was significant capacity in the downstream network to meet additional gas commitments.

